📊 Super Store Sales Analysis (Excel Dashboard)
Analyzed Super Store sales data to uncover key insights on product performance, regional trends, and profitability. The dataset contained raw transactional data that required cleaning, structuring, and transformation to make it suitable for analysis.
Performed data cleaning and transformation using Power Query, including removing duplicates, correcting data types, and creating conditional and custom columns. Built a data model and calculated KPIs using Power Pivot, and conducted time-series analysis by extracting year, month, and weekday/weekend from the date field. Developed multiple Pivot Tables to analyze sales trends, category performance, and regional distribution.
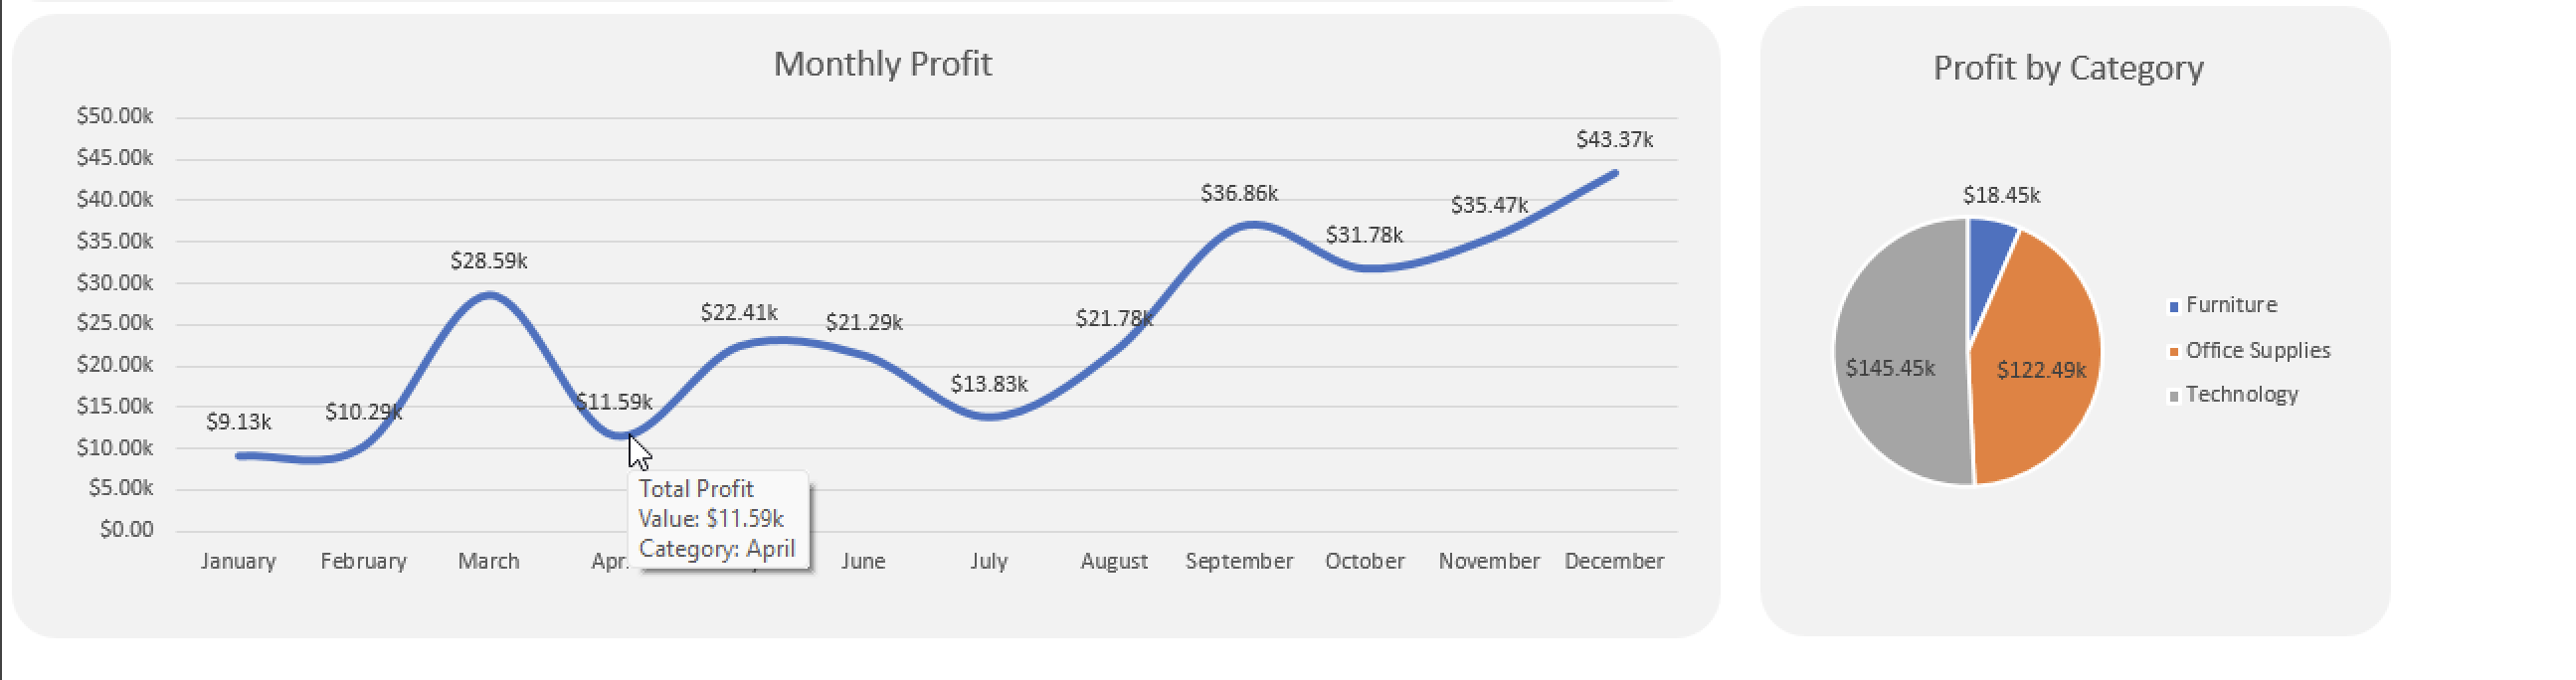
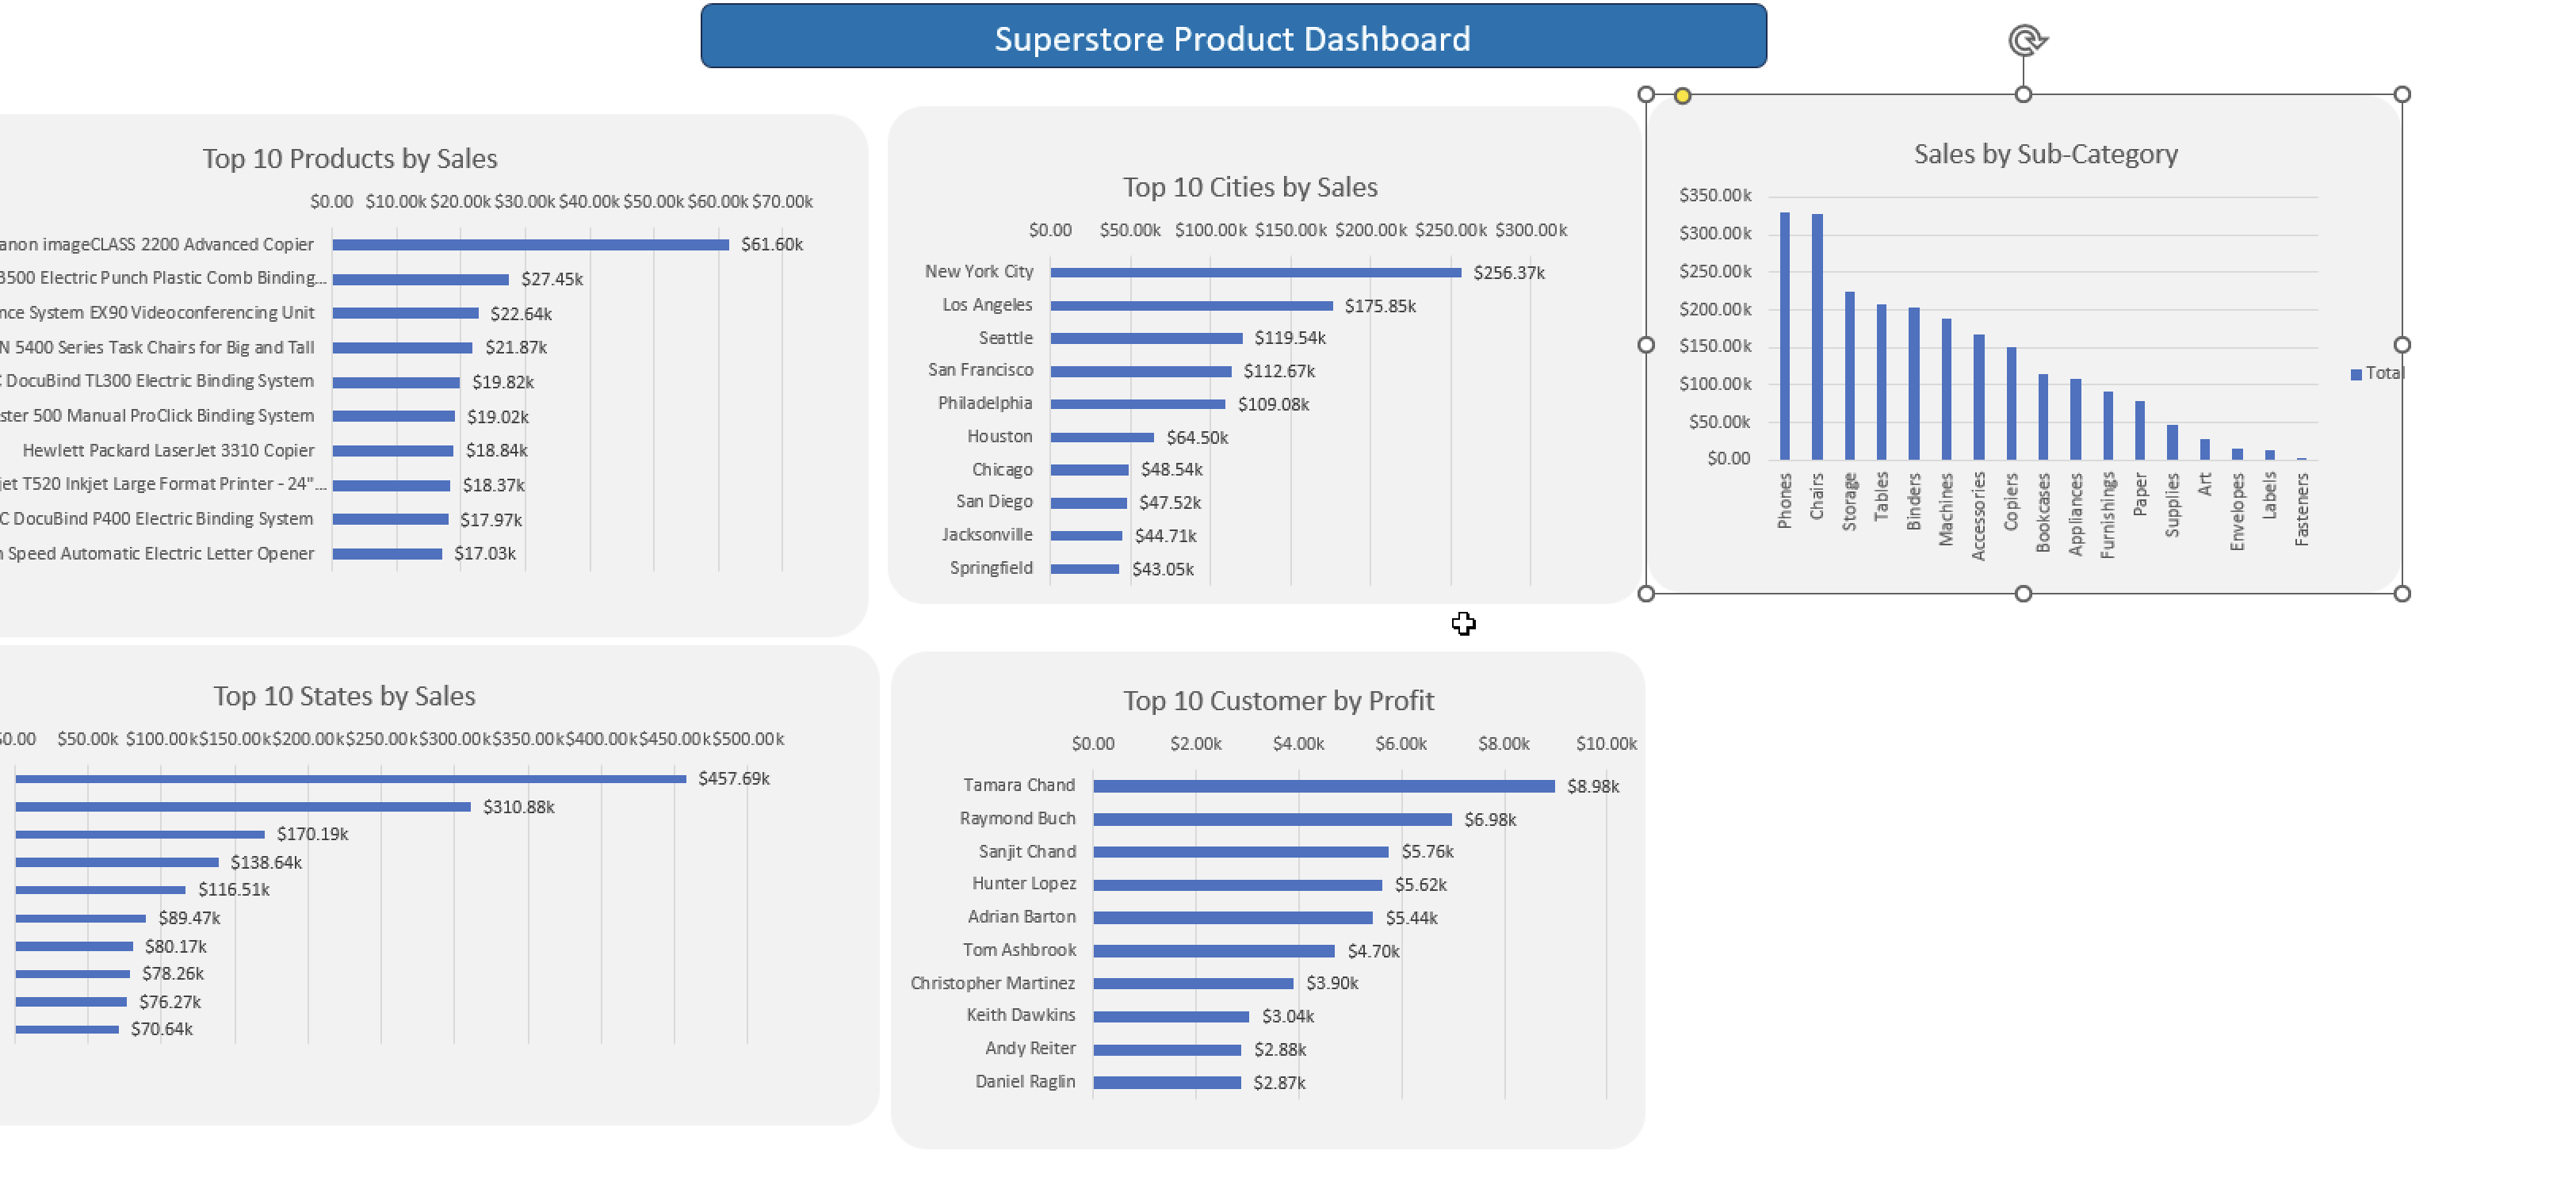
Designed an interactive Excel dashboard (Dashboard-1) using charts, KPI cards, and slicers to enable dynamic exploration of the data.
Key insights include identifying the Cannon ImageClass 220 Advanced Copier as the top-selling product, Technology as the highest revenue-generating category ($21.49K), and the West region contributing the most sales (31%). The analysis also revealed that Phones are the most in-demand sub-category and that sales follow a consistent upward trend, peaking in December 2017.