Project Archive
A collection of data-driven solutions, dashboards, and automated pipelines.
Each project represents a business question answered.
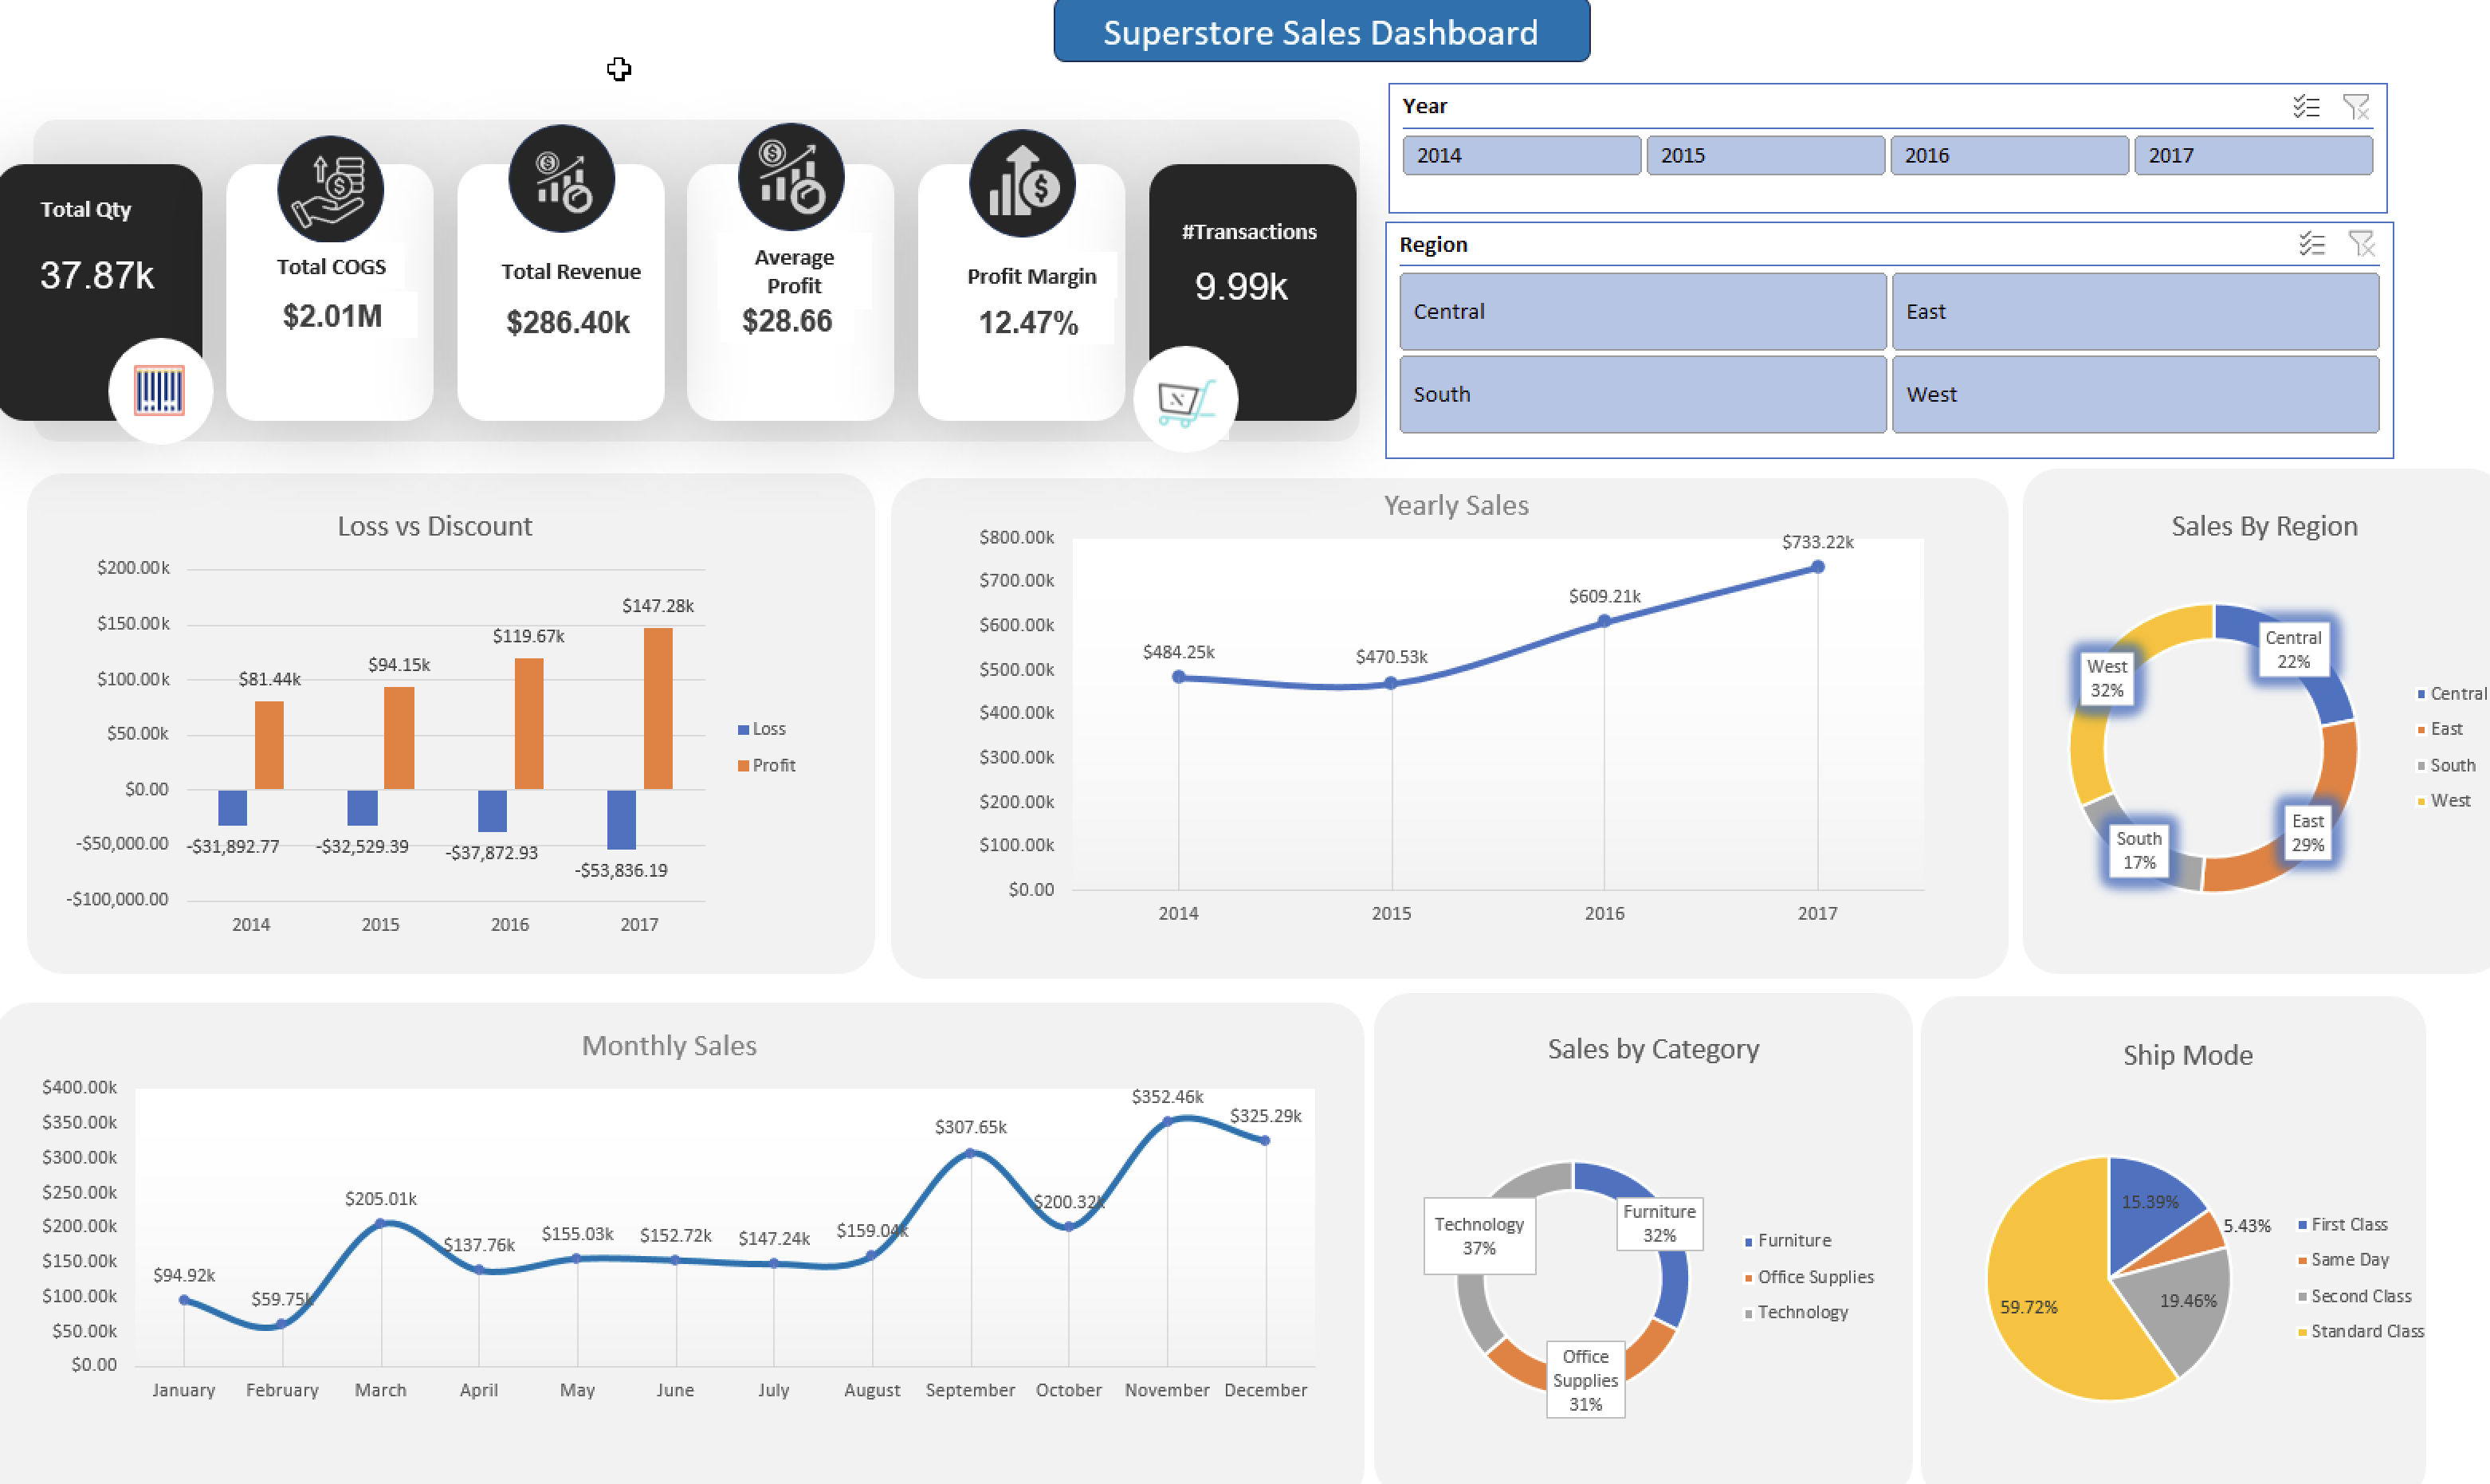
Super Store Dales Data Analysis
📊 Super Store Sales Analysis (Excel Dashboard)Analyzed Super Store sales data to uncover key insights on product performance, regional trends, and profitability. The dataset contained raw transactional data that required cleaning, structuring, and transformation to make it suitable for analysis.Performed data cleaning and transformation using Power Query, including removing duplicates, correcting data types, and creating conditional and custom columns. Built a data model and calculated KPIs using Power Pivot, and conducted time-series analysis by extracting year, month, and weekday/weekend from the date field. Developed multiple Pivot Tables to analyze sales trends, category performance, and regional distribution.Designed an interactive Excel dashboard (Dashboard-1) using charts, KPI cards, and slicers to enable dynamic exploration of the data.Key insights include identifying the Cannon ImageClass 220 Advanced Copier as the top-selling product, Technology as the highest revenue-generating category ($21.49K), and the West region contributing the most sales (31%). The analysis also revealed that Phones are the most in-demand sub-category and that sales follow a consistent upward trend, peaking in December 2017.
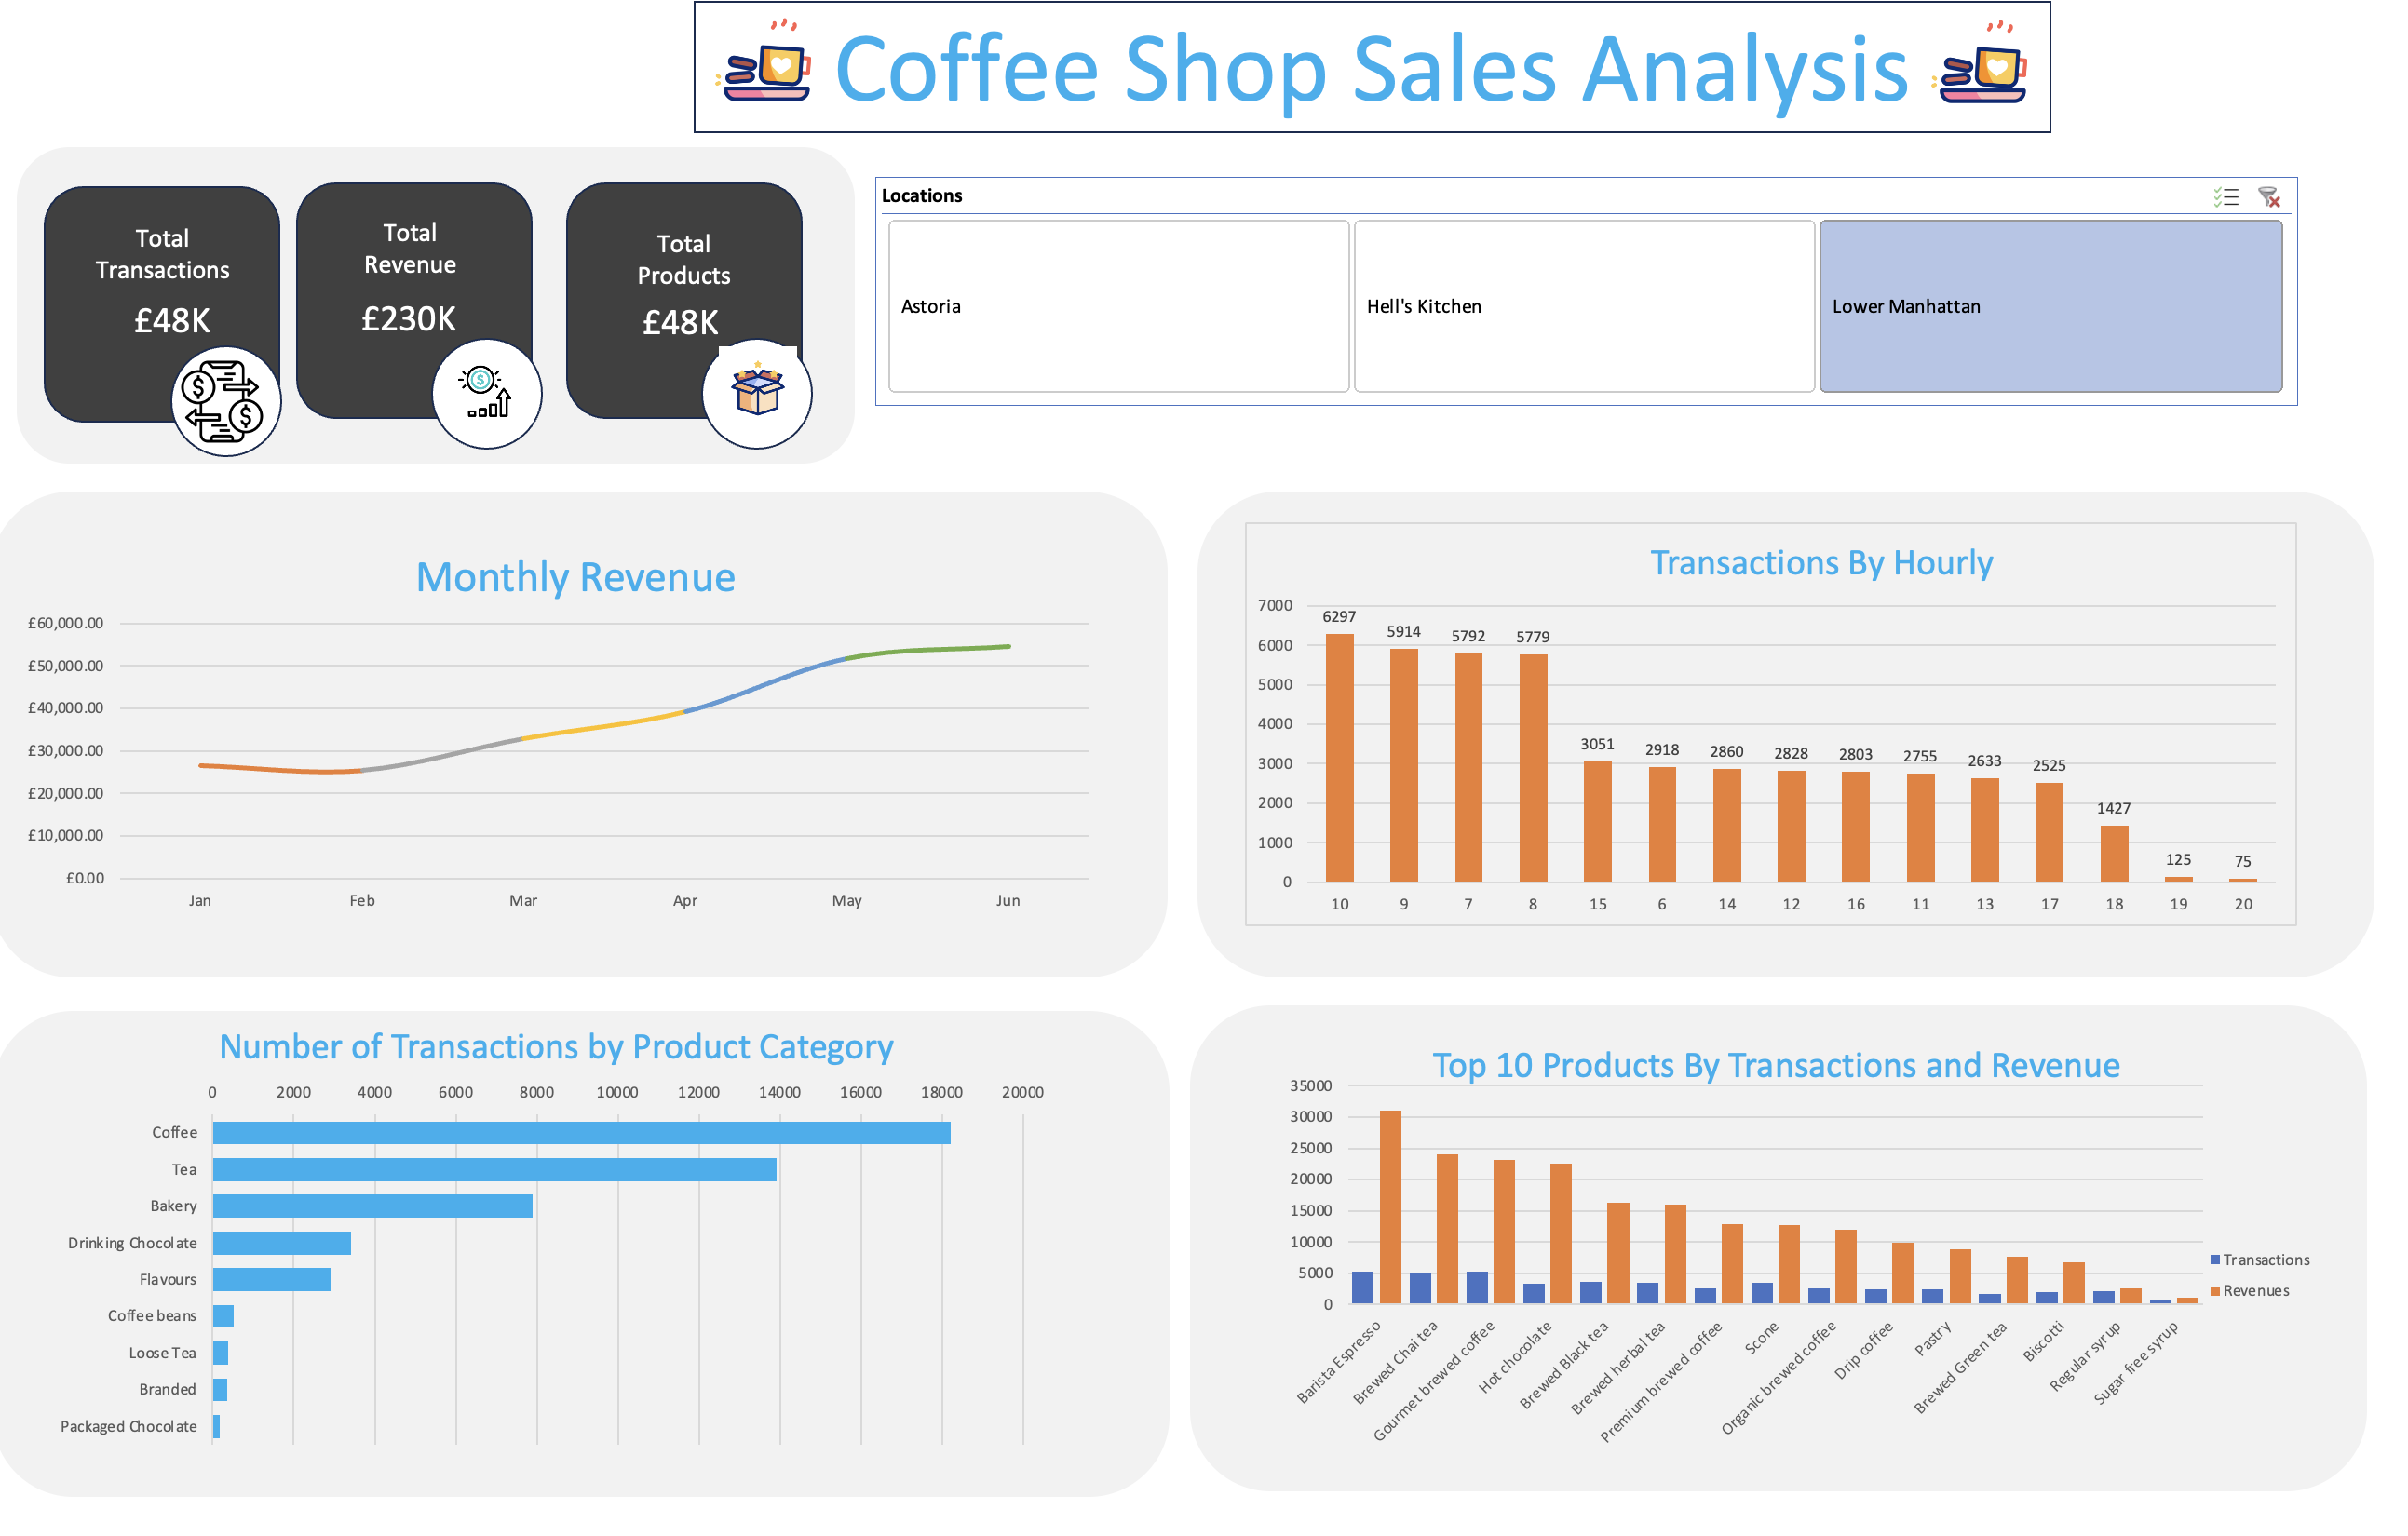
Coffee shop Sales Analysis
Excel Pivot Tables DashboardCoffee shop sales analysisThe business questionA coffee shop owner needed to understand which products, times of day, and customer patterns were actually driving revenue — and where operational inefficiency was quietly costing money.What I didCleaned and structured 12 months of transactional data in Excel. Built dynamic Pivot Table dashboards segmented by product category, hour of day, and day of week. Applied VLOOKUP and IF-based formulas to flag underperforming SKUs and surface revenue concentration risk.Key findingMorning hours (7–10am) generated 61% of daily revenue despite representing only 23% of operating hours — recommending targeted staffing and upsell strategies during that window could lift daily revenue by an estimated 8–12%.
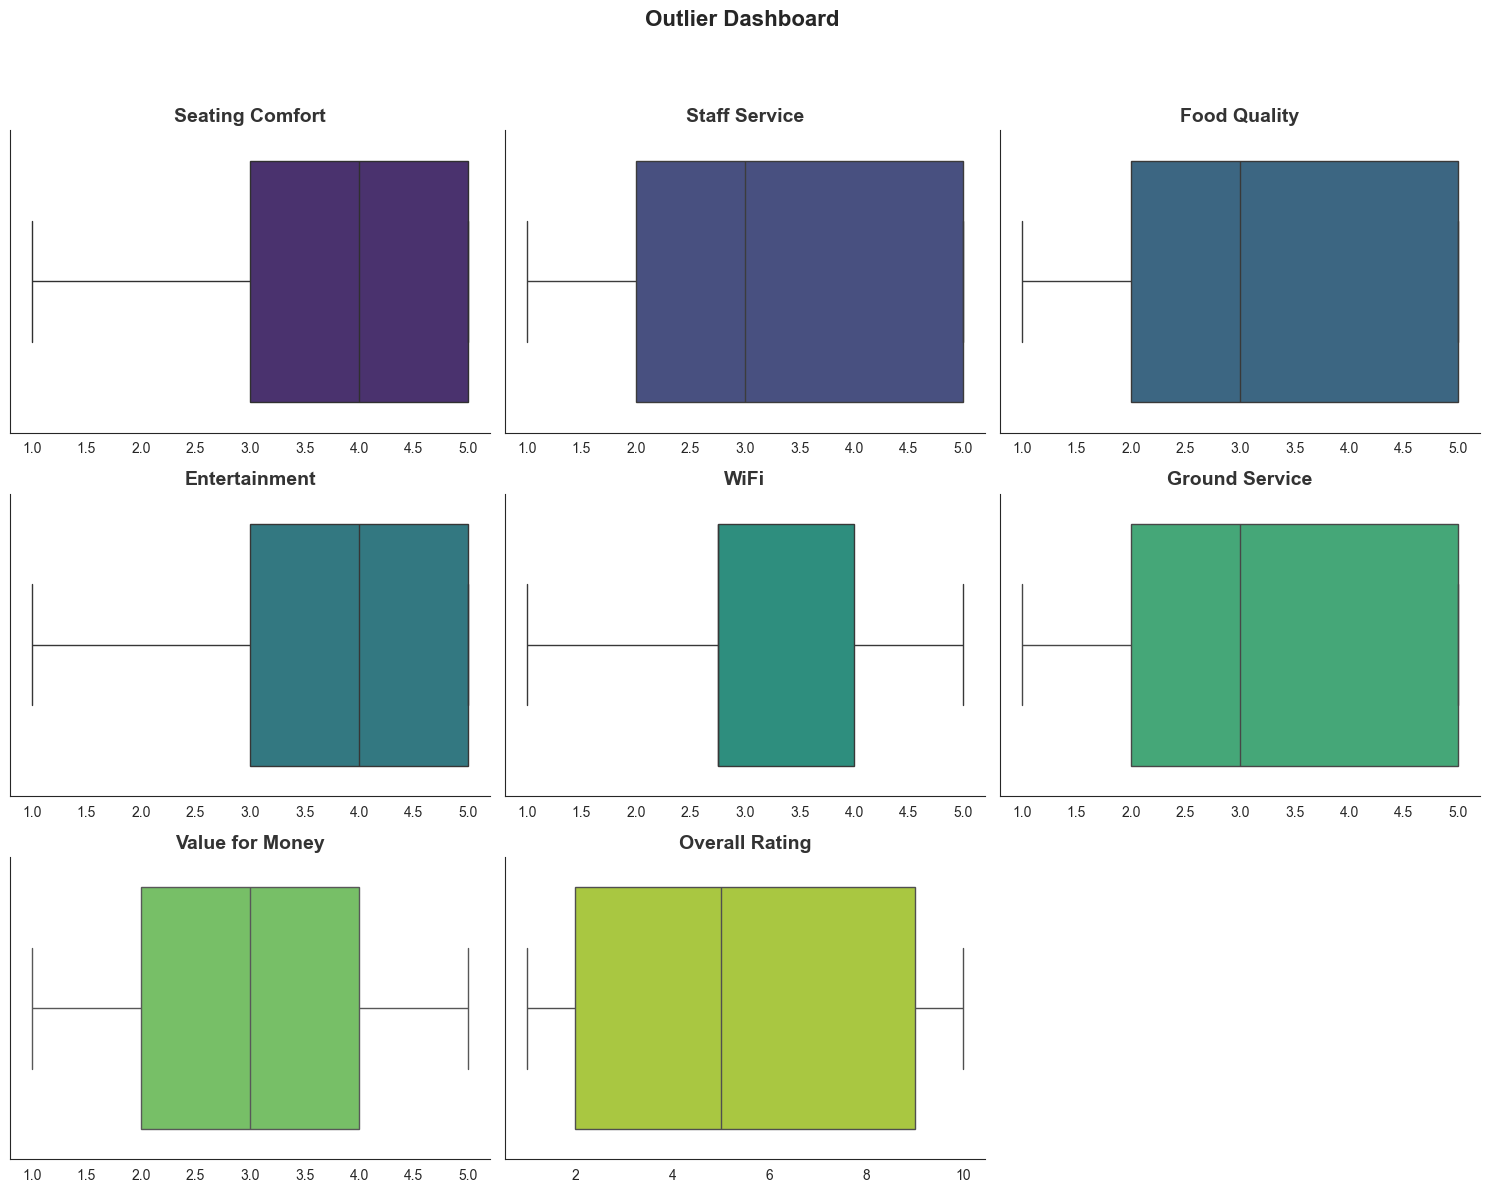
Emirates Customer Reviews Data Analysis
Emirated customer reviews data analysis
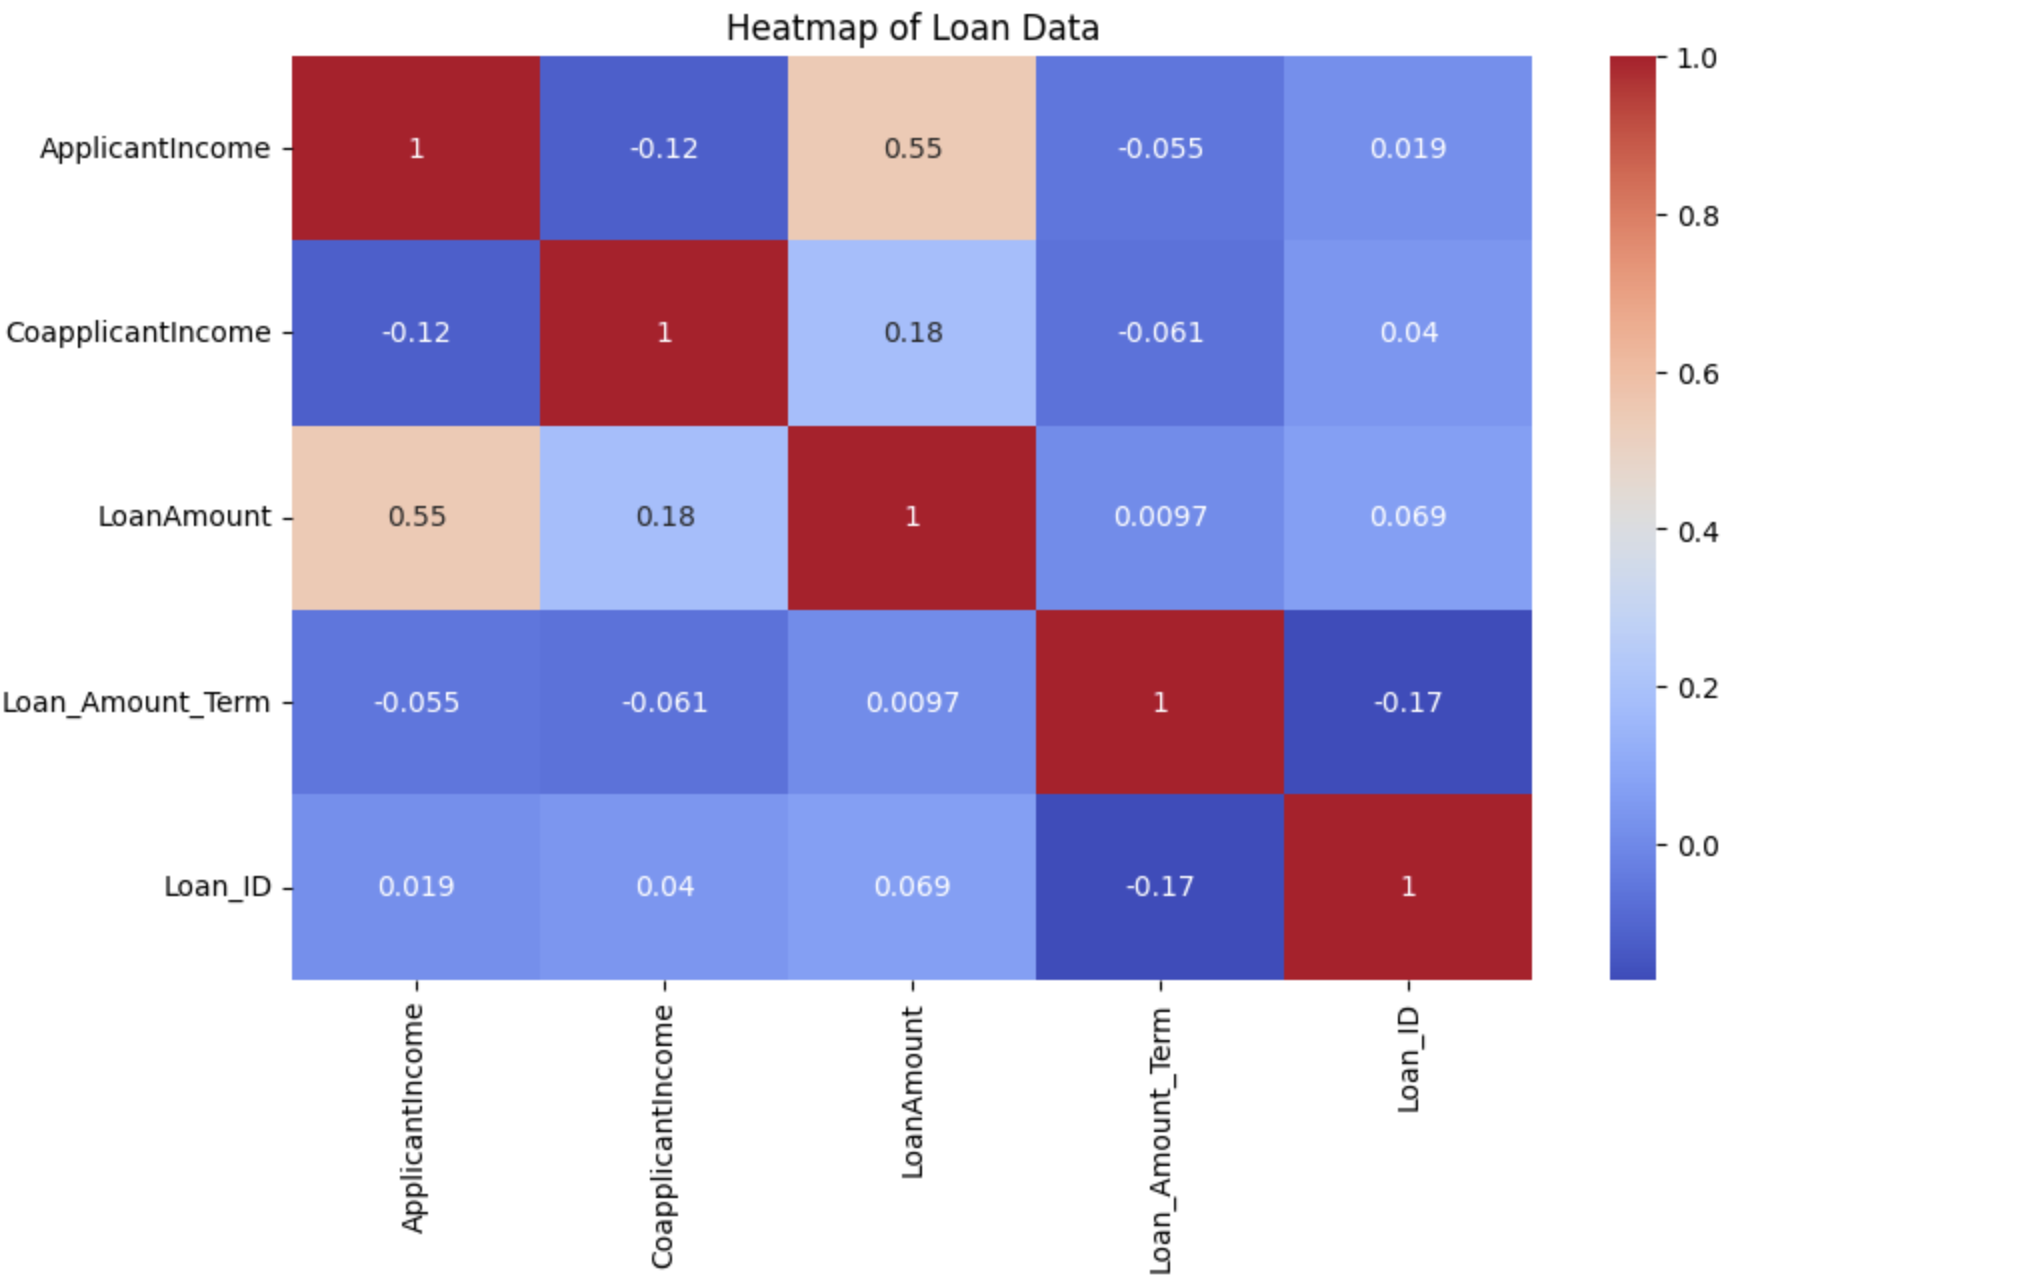
🚀 Automating Loan Application Processing with Machine Learning 🤖💰
🚀 Automating Loan Application Processing with Machine Learning 🤖💰
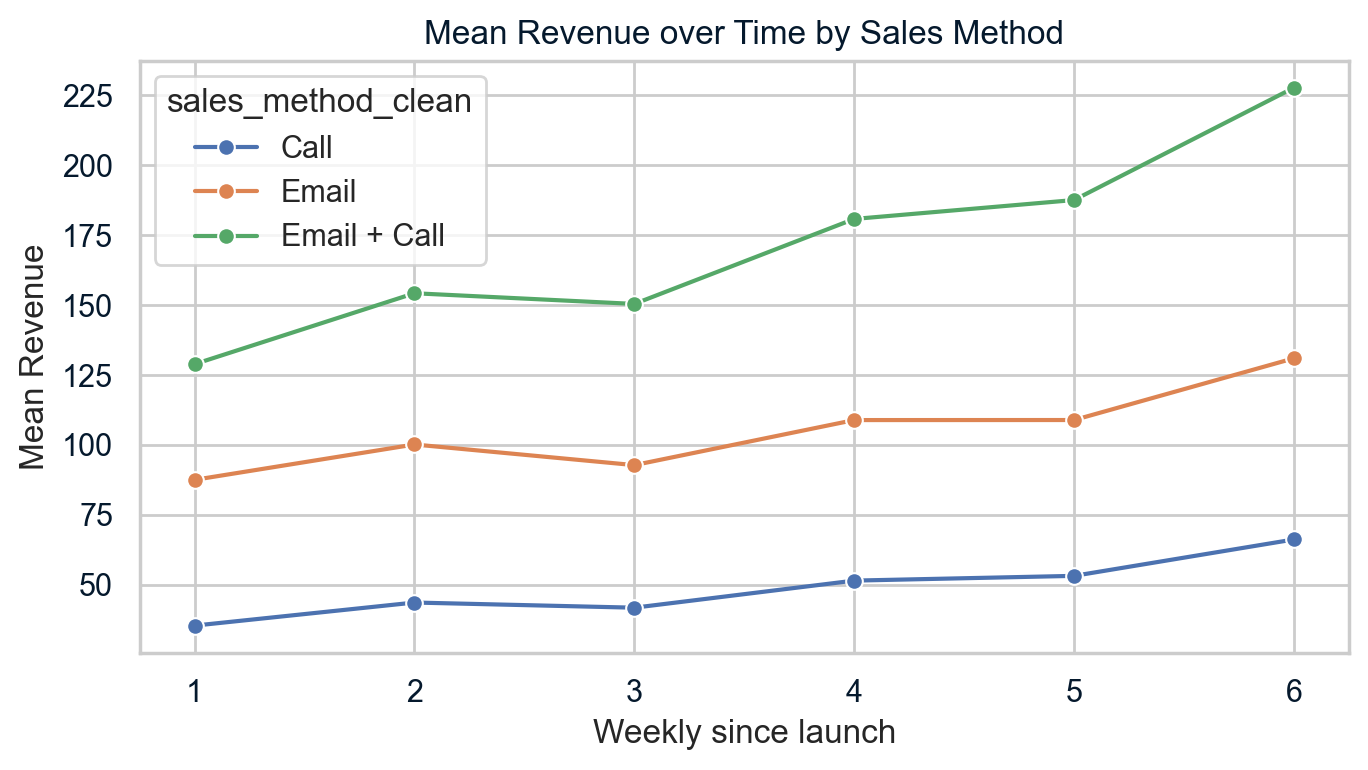
Product Sales Analysis: Optimizing Sales Methods for New Stationery Line
In response to changing consumer behavior, the company tested three different sales strategies to identify the most effective approach for this new product line: Email: Targeted emails at launch and 3 weeks later. Call: Direct phone calls from the sales team (avg. 30 mins/customer). Email + Call: An initial email followed by a shorter needs-assessment call (avg. 10 mins/customer).
Hi! Ask me about Raj's skills or projects.